# Grafana
Grafana allows you to query, visualize, alert on and understand your metrics no matter where they are stored.
Grafana will help us visualize our metrics into dashboards. It comes bundled with rich support for many of the most popular time series databases like Graphite, Prometheus, Elasticsearch, OpenTSDB and InfluxDB. Grafana supports querying Prometheus. The Grafana data source for Prometheus is included since Grafana 2.5.0 (2015-10-28).
Go to Grafana and log in as admin admin (confirm your password)
# Data Source
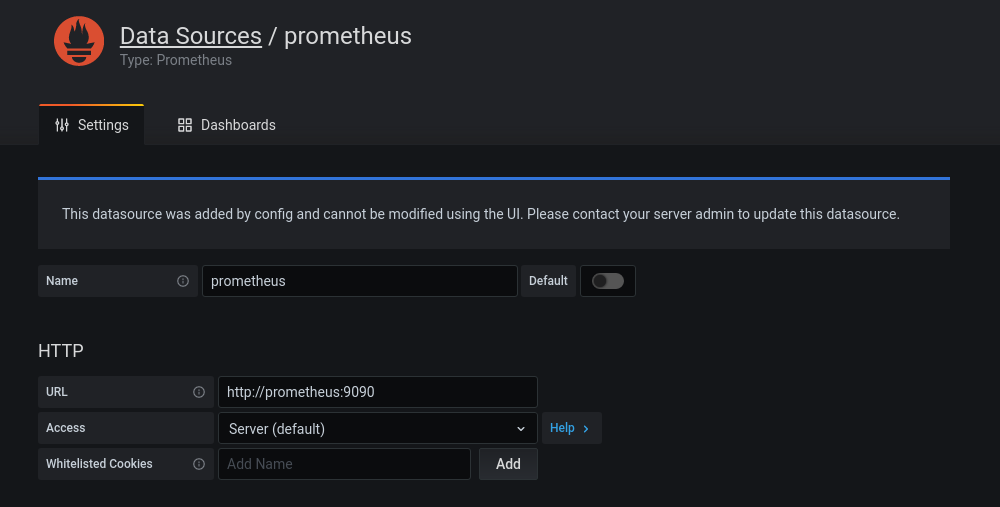
This Grafana instance is already configured to use the Prometheus database. You can check it by going to Configuration/Data Sources.
# Default Dashboard
Some dashboards are bundled in this workshop. This will help you get used to Grafana and create your own dashboard.
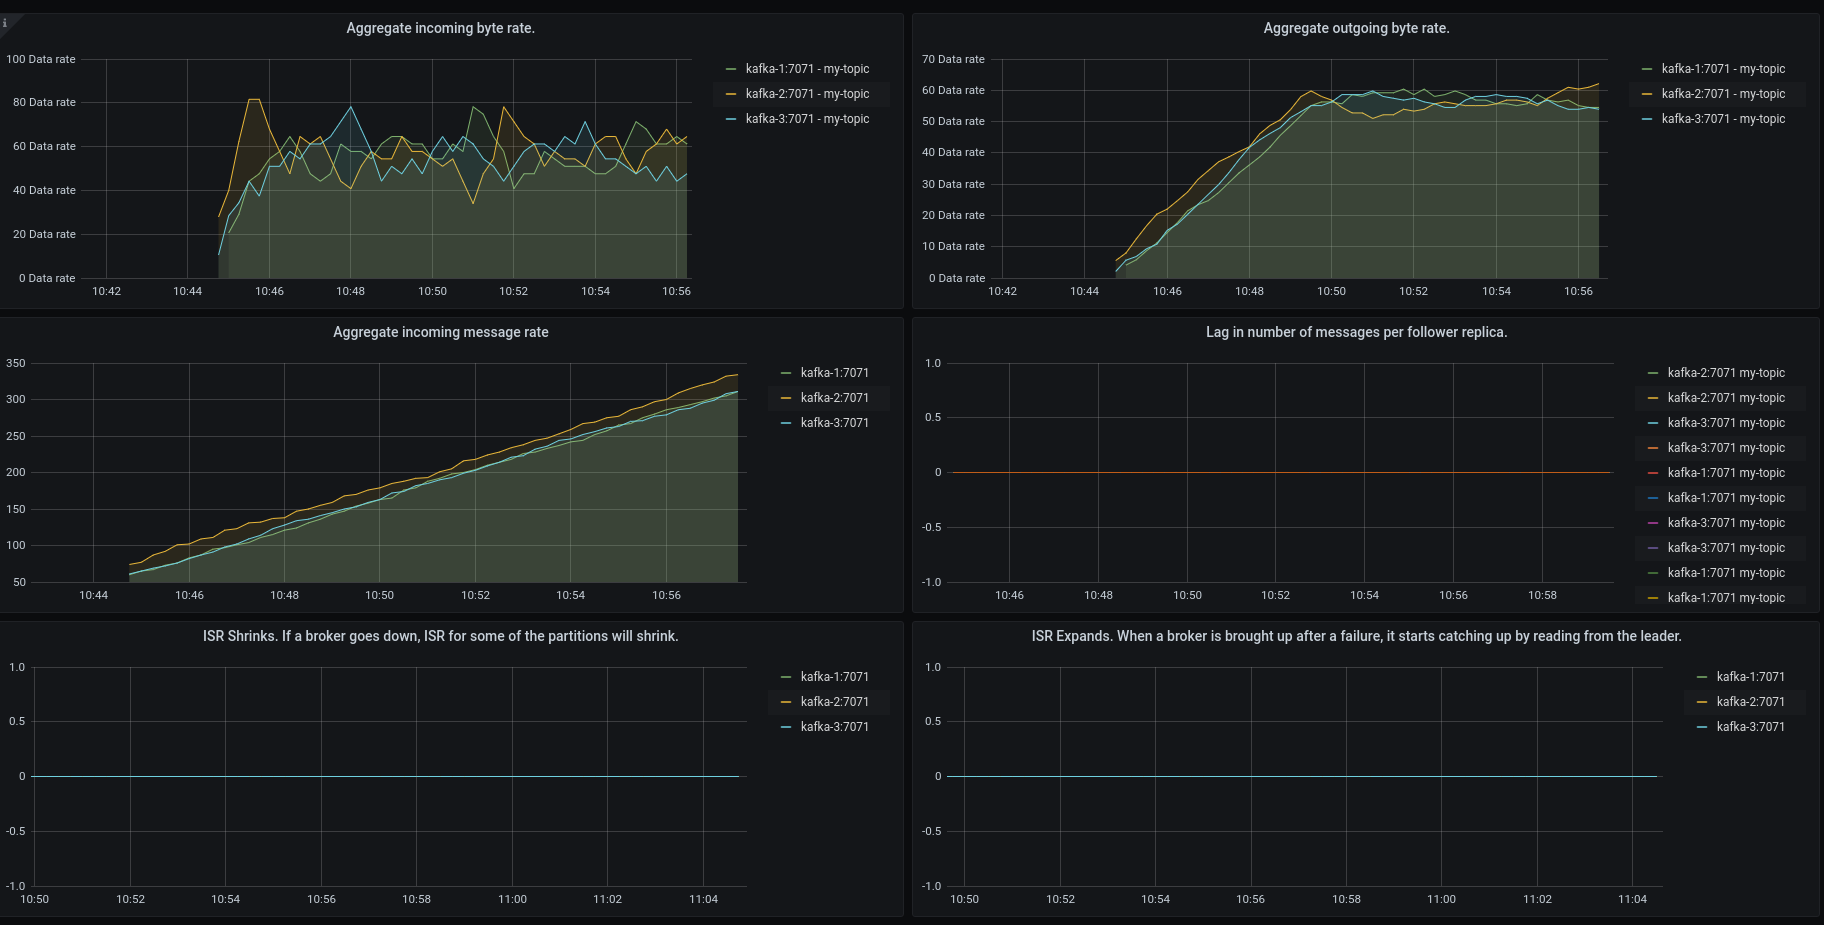
# Global Dashboard
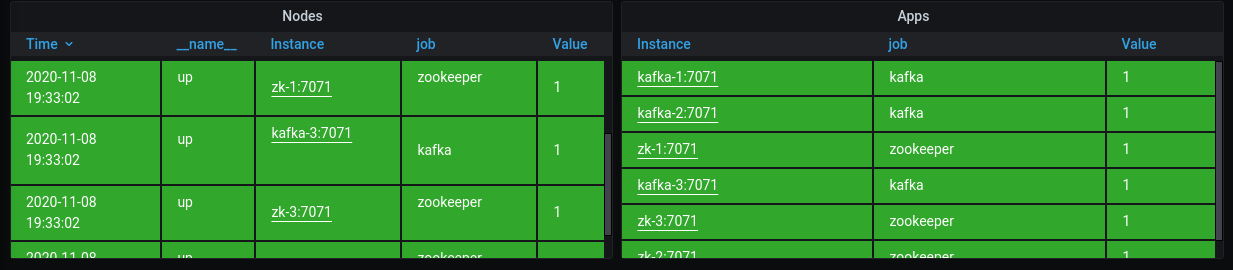
Look at the Global dashboard. You should see all the Apache Kafka and Apache ZooKeeper instances listed. It should also show that all the instances are healthy.
# JVM Dashboard
Next, look at the dashboard Kafka Broker / JVM Memory.
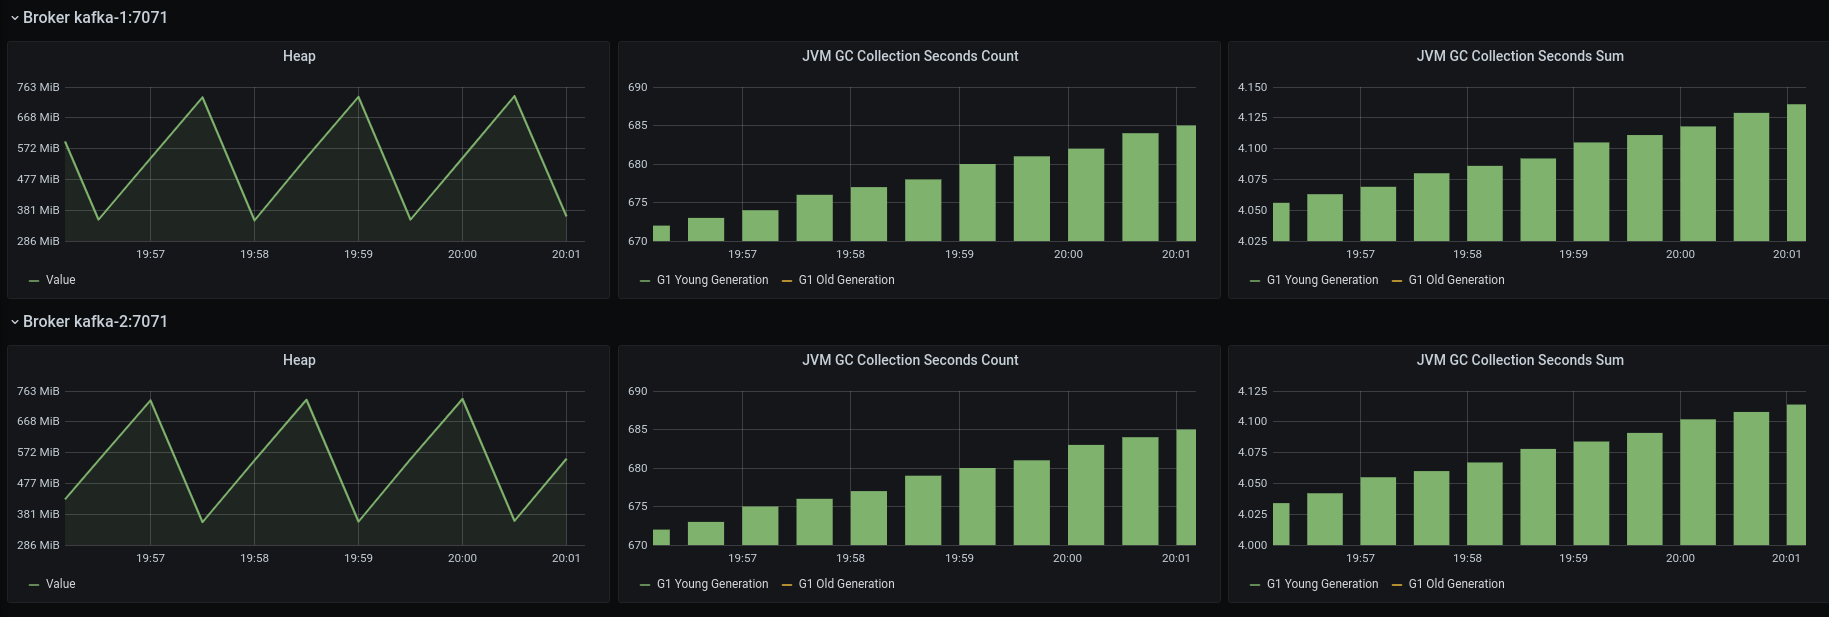
This dashboard has a row per instance. It shows the JVM's used heap memory and the time spend in GC per generation for each instance.
# Create your dashboard
Create a new dashboard. On the top left, click on the floppy disk icon to save and name your dashboard as Kafka Dashboard.
# Instance Variable
Next, click on the gearwheel at the top left. You are going to create a new variable to filter your dashboard per instance. Click Variables and add variable.
Name your variable instance, choose the Prometheus data source and set the regex as label_values(instance)
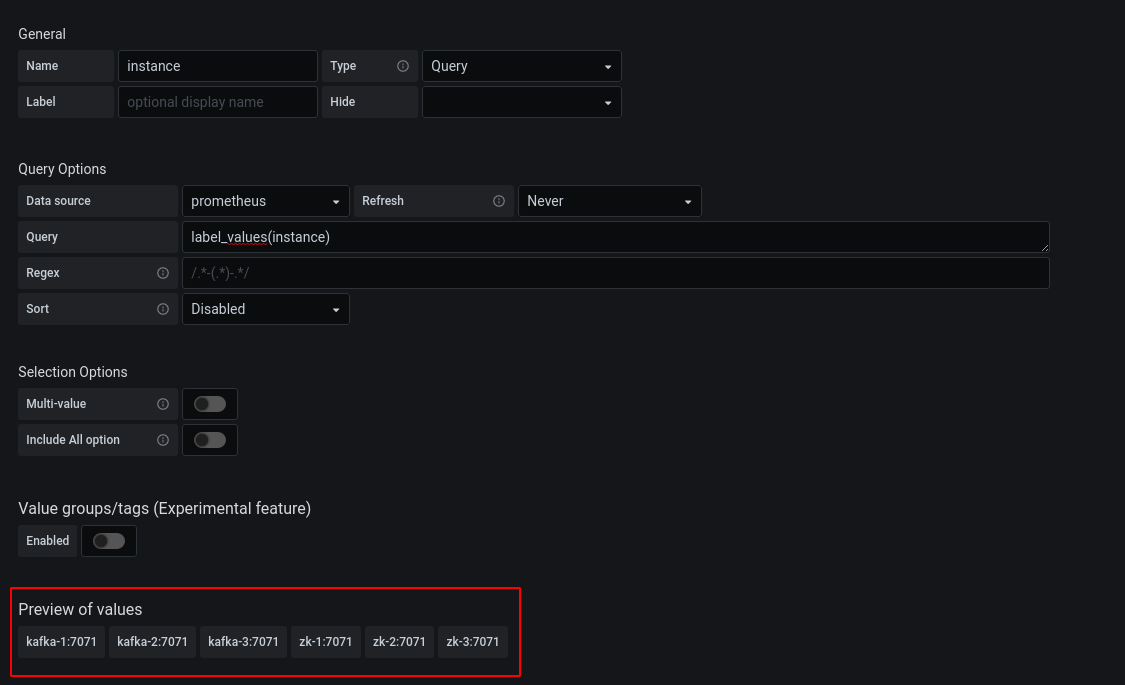
You should see the instances in the section Preview of values.
Finally, press Save Dashboard
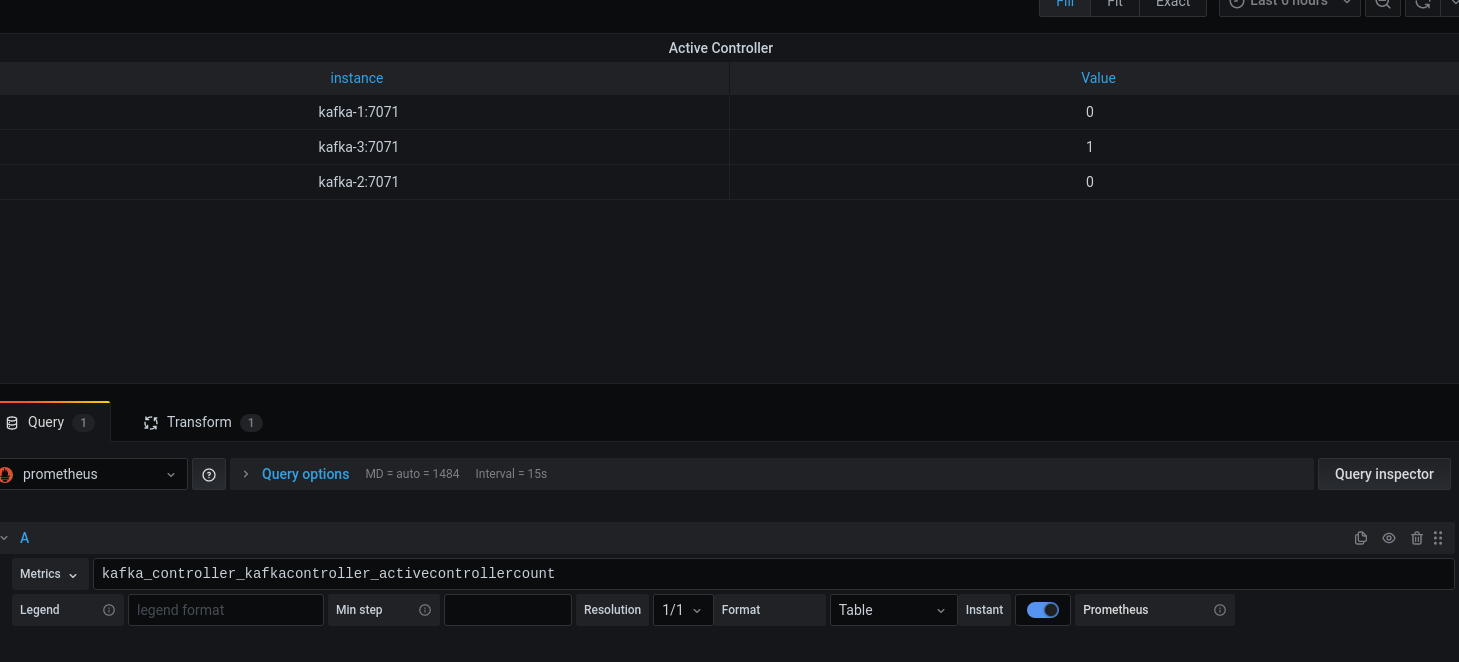
# Active Controller Panel
Click on ̀ Add a new panel`, You are going to create a new panel to display which Apache Kafka instance is the controller.
On the left, in the Settings section, set the title to Active Controller and choose Table Visualization.
In the Query section, set the metrics as kafka_controller_kafkacontroller_activecontrollercount. You should see all the data for this metric.
As you can see, the metric is updated every 15 seconds. This interval is configured in the prometheus.yml file.
global:
  scrape_interval:     15s
For this panel, you only need the last value, so you can toggle the Instant button in the Legend section.
An Instant Query returns the last value for each time series which shows a good summary of the data shown in the graph. Grafana Documentation
Finally, click on the Transform tab, select Organize fields to hide useless columns like job, time and __name__.
Your table should look like this:
Don't forget to click on the Save button.
# Your turn to play
Now that you have the keys. We let you make your own dashboard.