# Getting Started
# Prerequisites
In order to follow along this workshop in the best possible way, some requirements should be met.
First of all, you need to have some basic knowledge of Apache Kafka: what are topics, partitions, brokers as this workshop will not explain these concepts.
Secondly, you need to have the following tools installed on your computer:
- Git,
- Docker,
- Docker Compose,
- and your favorite IDE
# Introduction
Kafka is increasingly used, and as a message broker it is often placed at the center of several software architectures, which can bring it to a critical place. Keeping track of what's hapenning around and inside the cluster is always a good idea and this is precisely what we will be doing during this workshop.
As you may already know Kafka comes in two main distributions, the first is provided by the Apache foundation and was first released on april 2014. And the second is provided by Confluent and based upon the first one.
Confluents offers a community edition and an enterprise edition which adds the following:
- Extra connectors (some are also included in the community edition)
- Graphical User Interface (Control Center)
- Security features (RBAC, Audit logs...)
- Replication tool
(you can check out the full feature list.)
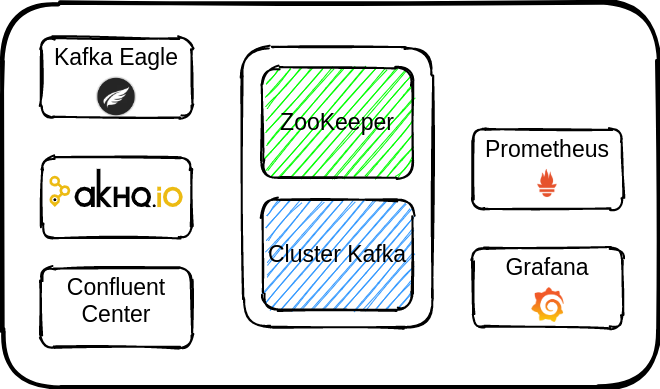
We will be using Confluent Kafka to compare what can be done with the built-in tools with what can be done with dedicated tools.
In order to do that we will:
- create a cluster, and perform checks to make sure everything will run as smoothly as possible
- add some data
- discover what can be done with Confluent tools
- check JMX metrics with JConsole
- export a few of these metrics with prometheus
- use Grafana to get a comprehensive view of the cluster
# Setup
Clone the repo
git clone https://github.com/vgallet/kafka-monitoring.git
Start the cluster
cd ./kafka-monitoring
docker-compose -f kafka-cluster.yml up -d
Check container status
docker-compose -f kafka-cluster.yml ps
The result should be
           Name                       Command            State                       Ports
---------------------------------------------------------------------------------------------------------------
kafka-monitoring_kafka-1_1   /etc/confluent/docker/run   Up      0.0.0.0:1098->1098/tcp, 0.0.0.0:9092->9092/tcp
kafka-monitoring_kafka-2_1   /etc/confluent/docker/run   Up      9092/tcp
kafka-monitoring_kafka-3_1   /etc/confluent/docker/run   Up      9092/tcp
kafka-monitoring_zk-1_1      /etc/confluent/docker/run   Up      2181/tcp, 2888/tcp, 3888/tcp
kafka-monitoring_zk-2_1      /etc/confluent/docker/run   Up      2181/tcp, 2888/tcp, 3888/tcp
kafka-monitoring_zk-3_1      /etc/confluent/docker/run   Up      2181/tcp, 2888/tcp, 3888/tcp
A container may not start correctly. If it happens, you can simply stop and delete all containers and linked volumes.
               Name                           Command            State               Ports
------------------------------------------------------------------------------------------------------
kafka-monitoring_kafka-1_1           /etc/confluent/docker/run   Exit 1
kafka-monitoring_kafka-2_1           /etc/confluent/docker/run   Exit 1
kafka-monitoring_kafka-3_1           /etc/confluent/docker/run   Exit 1
Stop and clean all volumes
docker-compose -f kafka-cluster.yml down -v --remove-orphans
# The Cluster
As you can see from the file kafka-cluster.yml, the cluster is composed with three Apache Kafka brokers and three Apache ZooKeeper nodes.
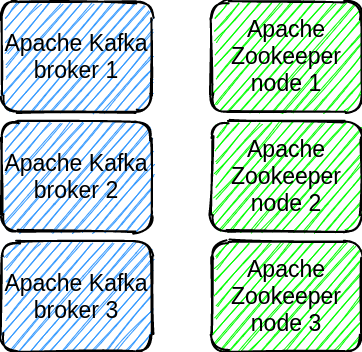
This is a vanilla installation! During this workshop, we are going to see how to monitor the brokers using basic command line, off-the-shelf tools and JMX metrics.